30 days to improve our crawler performance by 50 percent
During the summer of 2020, we got in touch with Netlify. We both wanted to work more closely together, and Netlify suggested we build an official integration for adding search on any Netlify website.
While easier said than done, we quickly realised that our Crawler was the perfect solution for this job. Our custom Crawler has grown a lot since its inception 2+ years ago. From localhost MVP, to Heroku, then a challenging migration to GKE, the Crawler has expanded in capabilities, and we have seen a steady growth of enterprise customers.
The tech has been polished for the last 2 years, so we were not worried about that. But there was the question of load and performance: we would need to be ready to handle at least twice the load that we currently process. That means being able to crawl around 100 millions pages per month.
Growing 2x overnight is not easy to do: there are enormous challenges to overcome with highly parallel code and infrastructure. But there are also a lot of ways to optimise.
In this article, we’ll see how very simple fixes added up can lead to an overall 50% performance increase.
Technical Overview
Before diving in, here is a quick glance at our technical stack.
The back end is powered entirely by NodeJS and Typescript, hosted in GKE (Google Kubernetes Engine), Cloud SQL. We use memorystore for the storage, RabbitMQ for the queues.
Initially, we were using small N1 machines with 1 VCPU and 4GB of memory, mostly because the main computation was done by our workers which are quite light and horizontally scalable.
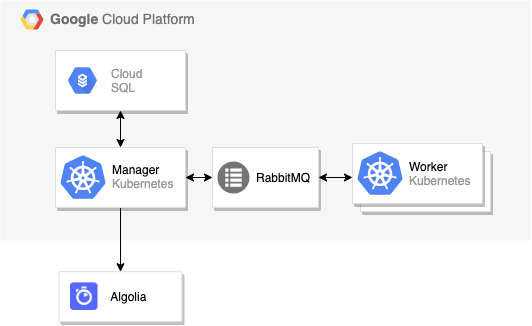
As you can see, it’s a fairly standard architecture where a manager orchestrates jobs and the number of workers are increasing with the load. Because every other part of this infrastructure is managed by Google, we thought most of our issues would appear in the manager, which is a SPOF (Single Point of Failure).
Identifying potential bottlenecks with a stress test
Managing a crawler is not a simple task. The process is heavily dependent on moving and fragile components, the queues, the database storage, the network itself, the horizontal scaling, the web standards, etc. To help us with this ongoing task, we are using Datadog and GKE to closely monitor all parts of our systems. Everything was built with defensive programming and the idea that anything can fail at any given time. This proves to be quite useful when the network becomes unreliable, or when we execute user-defined JavaScript code in our back end.
While we have a generally strong hold on our systems, that does not mean everything is easy, especially when estimating how much you can grow. So we took this opportunity to put in place end-to-end benchmarking so we can discover new culprits, highlight potential bottlenecks, and plan our future improvements.
To do so, we used our staging environment, and wrote a script to create and trigger a few thousand crawlers in a very short period of time. While this number may not seem high at first, each crawler can actually discover, fetch, extract and index millions of URLs at the same time.
Failing fast
Since we were pretty optimistic about these new capabilities, we did not plan to have failures at the very beginning. This of course meant that everything failed pretty quickly.
A very good learning we had at the beginning, and a good reminder that cutting corners can bite you years later: our Kubernetes cluster was created manually so our staging and production have diverged quite significantly, whether intentional (for cost saving purposes) or by mistake.
The first test failed because the cluster was not able to scale and take the load we currently had in production. So the first batch was pretty much useless. This however proved to be a good time to sync our configuration and put Terraform back in our roadmap. Terraform helps orchestrate complex infrastructure and replicate at will, and is especially useful with Kubernetes, making it a real game changer for us (and everyone managing a fleet of services).
Failing hard
Despite the flawed start, we were still quite confident in the overall stability of the infrastructure. But it turned out that there were more points of failure along the way. While this may have hurt our developer feelings, it was for the best. Here is how we failed, what we learned, and where we improved our stack.
Reducing queues footprint in RabbitMQ
We use RabbitMQ intensively to transport our jobs across our multi-zone cluster. Workers are subscribing to a single fanout queue that load-balances the jobs, and GKE is using the metrics to autoscale our cluster depending on the load. Nothing fancy, but it works great and we’ve had perfect confidence in this very robust piece of software.
However, while pages are fetched and extracted in those workers, jobs are also sent back to a different indexing service that pushes the jobs to our monitoring stack, and finally to Algolia. This indexing step was split per crawler, which means that we had N queues for N customers.
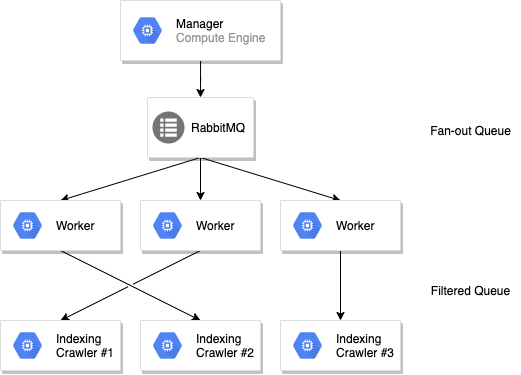
With this setup we can scale the workers — the most CPU- intensive task — based on load, but keep control of each crawler independently after this step so that we can compute global scope without requiring a shared memory (e.g., global rate limit of the indexing, maximum URLs, payload validation).
Little did we know having a lot of empty queues had a huge impact in RabbitMQ. All queues were consuming a lot of memory and CPU — even when idle. During the benchmark we quickly reached an unseemly high ceiling that we previously thought was unreachable.
Fortunately, we thought of a solution: use short-lived queues with the [built-in TTL feature(https://www.rabbitmq.com/ttl.html#queue-ttl)]. However, a second issue arose with this: the queue configuration cannot be modified after it is created, a problem that hit us hard in production because during development we always recreate the full queue from scratch. Deleting old queues can take quite some time, and because we developers aim to be lazy in a smart way we found a perfect naive solution, and put the crawler version in the queue name. This way, each time we deploy we now start from a “brand new” environment, and RabbitMQ just has to automatically dispose of the old queues after a few minutes.
Solutions:
- Use very short live queues (15minutes) even if we know we will process things everyday
- Version queue names so you can always discard and recreate everything from scratch
Improving cost and resources usage in Kubernetes
Kubernetes is a very complicated system to master, and in the crawler team we are not infrastructure experts. When we did our migration almost 2 years ago to enable better and automatic scaling, we mostly focused on simply making things work while keeping cost acceptable. While doing those benchmarks, we realized small machines do not make sense for everything.
Costs do not increase linearly, aka bigger machines cost less. Kubernetes always uses a small amount of CPU and memory so the bigger the machine the smaller the footprint. It’s also easier to pack more pods into a single big machine rather than trying to fit pods in 1 VCPU, especially once you want to have a good margin to grow.
Overall, after the migration, we reduced our base cost, wasted less CPU and improved our performance just by changing a few requirements.
Solutions:
- We migrated to E2 Highcpu cost-optimised machines, with no hard drive
- We changed all ressources requirements to allow Kubernetes to play a better Tetris game (NB: default Kubernetes scheduler will not try to fill 100% of your node by default)
Serverless and scalability
After the same configuration was applied, the second benchmark also failed quickly because we did not think through scale properly. In Kubernetes, even if you are now “serverless”, you are still tied to a horizontal scaling strategy, disk scaling strategy, CPU scaling strategy, etc.. Not everything will scale magically, and costs usually scale with, well, scaling — and you might be relying on a managed service like a Postgres or a Redis that is not yet configured to take a huge load.
That means configuring everything to have a better minimum, a more permissive maximum, autoscaling based on load on managed service, and high availability everywhere (zonal or regional).
On our setup that means:
- Scaling our workers with Datadog metrics (RabbitMQ metrics in this case)
- Allowing hundreds of workers in our HPA (Horizontal Pod Autoscaler) instead of just a few dozen (having a max helps to control costs)
- Autoscaling and activating High Availability on our Postgresql in GCP
- Activating HA on our memorystore
And even though 99% of time the load is “normal”, High Availability, Regional Replication and benchmarking — which you need to be sure you are able to handle a big spike — add up to the initial costs.
In GCP that can mean hundreds of dollars more per month just for a few checkboxes here and there, and double that if you have 1:1 staging. So having everything well tested and configured can cost quite a lot but that’s the hidden price to pay to have satisfied customers in the end.
Decreasing DNS latency and errors > 94% perf increase
Something that is highly overlooked until you have issues, is the DNS stack. Usually this is something low level that does not need further optimization. But once you care about the network and high performance at scale you can run into big trouble.
Once the infrastructure was corrected and the benchmark started running, we started monitoring everything in our Datadog dashboard, and we noticed an increase of DNS issues. Being on GCP in a very strong setup we were quite surprised that simple calls to websites were failing, and even worse, that our Algolia calls were also failing.
The errors were cryptic and not helpful at all, like “connect EADDRNOTAVAIL 95.211.230.144:443” “getaddrinfo ENOTFOUND 8j0ky6j9fn-1.algolianet.com” “Connection timeout”.
Obviously we knew that Algolia was up and running and we tried to reproduce this issue locally but it was nearly impossible due to our own personal computers limitation. Those errors only happened during high load and we couldn’t reproduce them under normal usage.
As mentioned before, this is a generally neglected topic so naturally we did not pay much attention to it before. But it was clear that our HTTP stack was not properly optimised.
After a good amount of time investigating we finally found several different issues:
- DNS resolution in NodeJS can be broken (github.com/nodejs)
- DNS resolution in NodeJS is not shared by default (nodejs.org)
- DNS resolution in Alpine images can be broken (cloudbess.com)
The first fix was to force IPv4 resolution by always using { family: 4 } in all our HTTP calls. This simple fix dramatically improved our resolution time and success.
http.get({ family: 4, ... }, cb);
The second bigger fix was to have a shared HTTP agent used all across our system, to only open one single TCP pool. This means passing the agent for simple fetch but also to the algoliasearch client.
// agent.tsexport const httpsAgent = new https.Agent({keepAlive: true,timeout: 60000,maxFreeSockets: 2000,scheduling: 'fifo',});// algolia.tsimport algoliasearch from 'algoliasearch';import { httpsAgent } from '../http/agent';export const requester = createNodeHttpRequester({httpsAgent,});const client = algoliasearch(appId, apiKey, {requester,});
The final fix about Alpine images in Kubernetes was to simply change the dnsConfig option on the Deployment/StatefulSet that needed it.
apiVersion: apps/v1kind: StatefulSetmetadata:name: crawlerspec:replicas: 1template:dnsConfig:options:- name: ndotsvalue: '1'
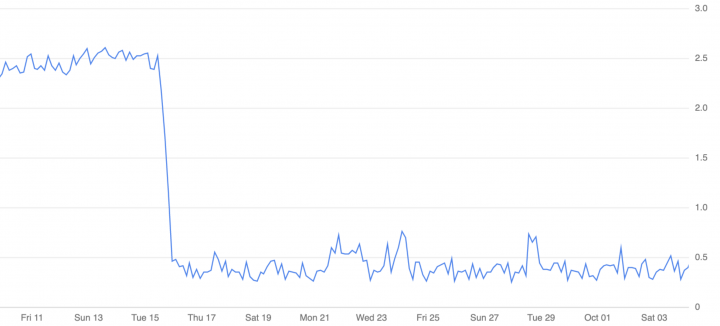
After all those fixes were deployed, the system went from 900K/day TCP connections to a mere 12K/day. 99% less CPU wasted, less time wasted, less money wasted.
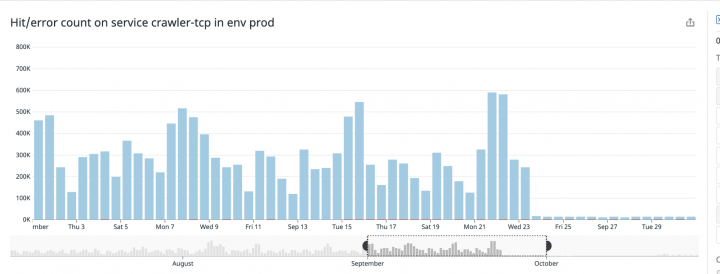
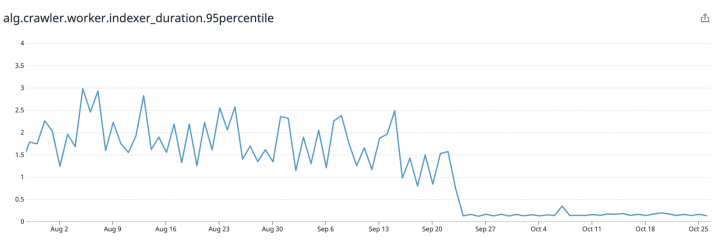
Even more amazing, we saw a dramatic reduction in time to reach Algolia when indexing records, from an average 1.5s to a stable 0.1s per call — whopping 94% perf increase. For something we thought was working fast enough that’s pretty good.
Solutions:
- Reuse HTTP agents
- Force IP v4 resolution
Other improvements
Docker Images size and build time improvement
When we build Docker images we usually struggle enough with a Dockerfile to not push the optimisation too far, especially if our build time is high. However there are a lot of gotchas, notably with layer, base images, filesystem snapshot, etc., that were worth looking into at this point.
We noticed two things during our review:
- Our image is too big
- Our image does not use cache properly
Why should we care about images that are too slow or too big? Well, the image size increases the spawn time in Kubernetes, as optimised images load faster so boot faster. That also means building faster and pushing hot fixes faster. So win-win.
To improve this, instead of copying the whole WORKDIR, we used the simple trick of only copying the package.json first, install deps and then copy the rest, so that Docker can cache the node_modules folder if nothing has changed. Our flow is to upgrade dependencies once a week, which means the build can use the cache the rest of the days.
FROM node:14.15.1-alpine AS baseENV NODE_ENV production# Install dependencies# python make and g++ are needed for native depsRUN apk add --no-cache bash python make g++# Setup the app WORKDIRWORKDIR /app/crawler# Copy and install dependencies separately from the app's code# To leverage Docker's cache when no dependency has changeCOPY package.json yarn.lock ./COPY pkg/crawler-manager/package.json pkg/crawler-manager/package.json[...]# Install dev dependenciesRUN yarn install --production=false --frozen-lockfile --ignore-optional# This the rest of the code, no cache at this pointCOPY . /app/crawler
Now the image is still too big because it contains all the node_modules required to build the final images (e.g., Typescript, webpack, babel…), at this point around ~600mb. Each worker created in Kubernetes was pulling this big image, thus increasing the boot time by a huge factor.
Thanks to the multi-stages build we decrease the size by >5x. With this simple addition at the end, the image now only weighs ~100mb (still massive but way better).
FROM node:14.15.1-alpine AS baseENV NODE_ENV production# Install dependencies# python make and g++ are needed for native depsRUN apk add --no-cache bash python make g++# Setup the app WORKDIRWORKDIR /app/crawler# Copy and install dependencies separately from the app's code# To leverage Docker's cache when no dependency has changeCOPY package.json yarn.lock ./# Install dev dependenciesRUN yarn install --production=false --frozen-lockfile --ignore-optional# This the rest of the code, no cache at this pointCOPY . /app/crawler# Build and keep only prod dependenciesRUN true && yarn build && yarn install --production=true --frozen-lockfile --ignore-optional# Final ImageFROM node:14.15.1-alpine as webUSER nodeWORKDIR /app/crawlerCOPY --from=base --chown=node:node /app/crawler /app/crawlerEXPOSE 8000
Front-end bundle size
You might think that performance at scale only involves improving the backend code, but a slow UI means a slow product in users’ minds. For us, more customers anticipated meant serving static files to more people, which means big bundles, which means a big load time, a bad UX and a big cost in bandwidth. So, while back-end performance was our primary focus, we also took the opportunity to work on our front-end bundle. There are a lot of details on how to enable tree shaking and optimise webpack bundles so I will provide just a short summary of what we did.
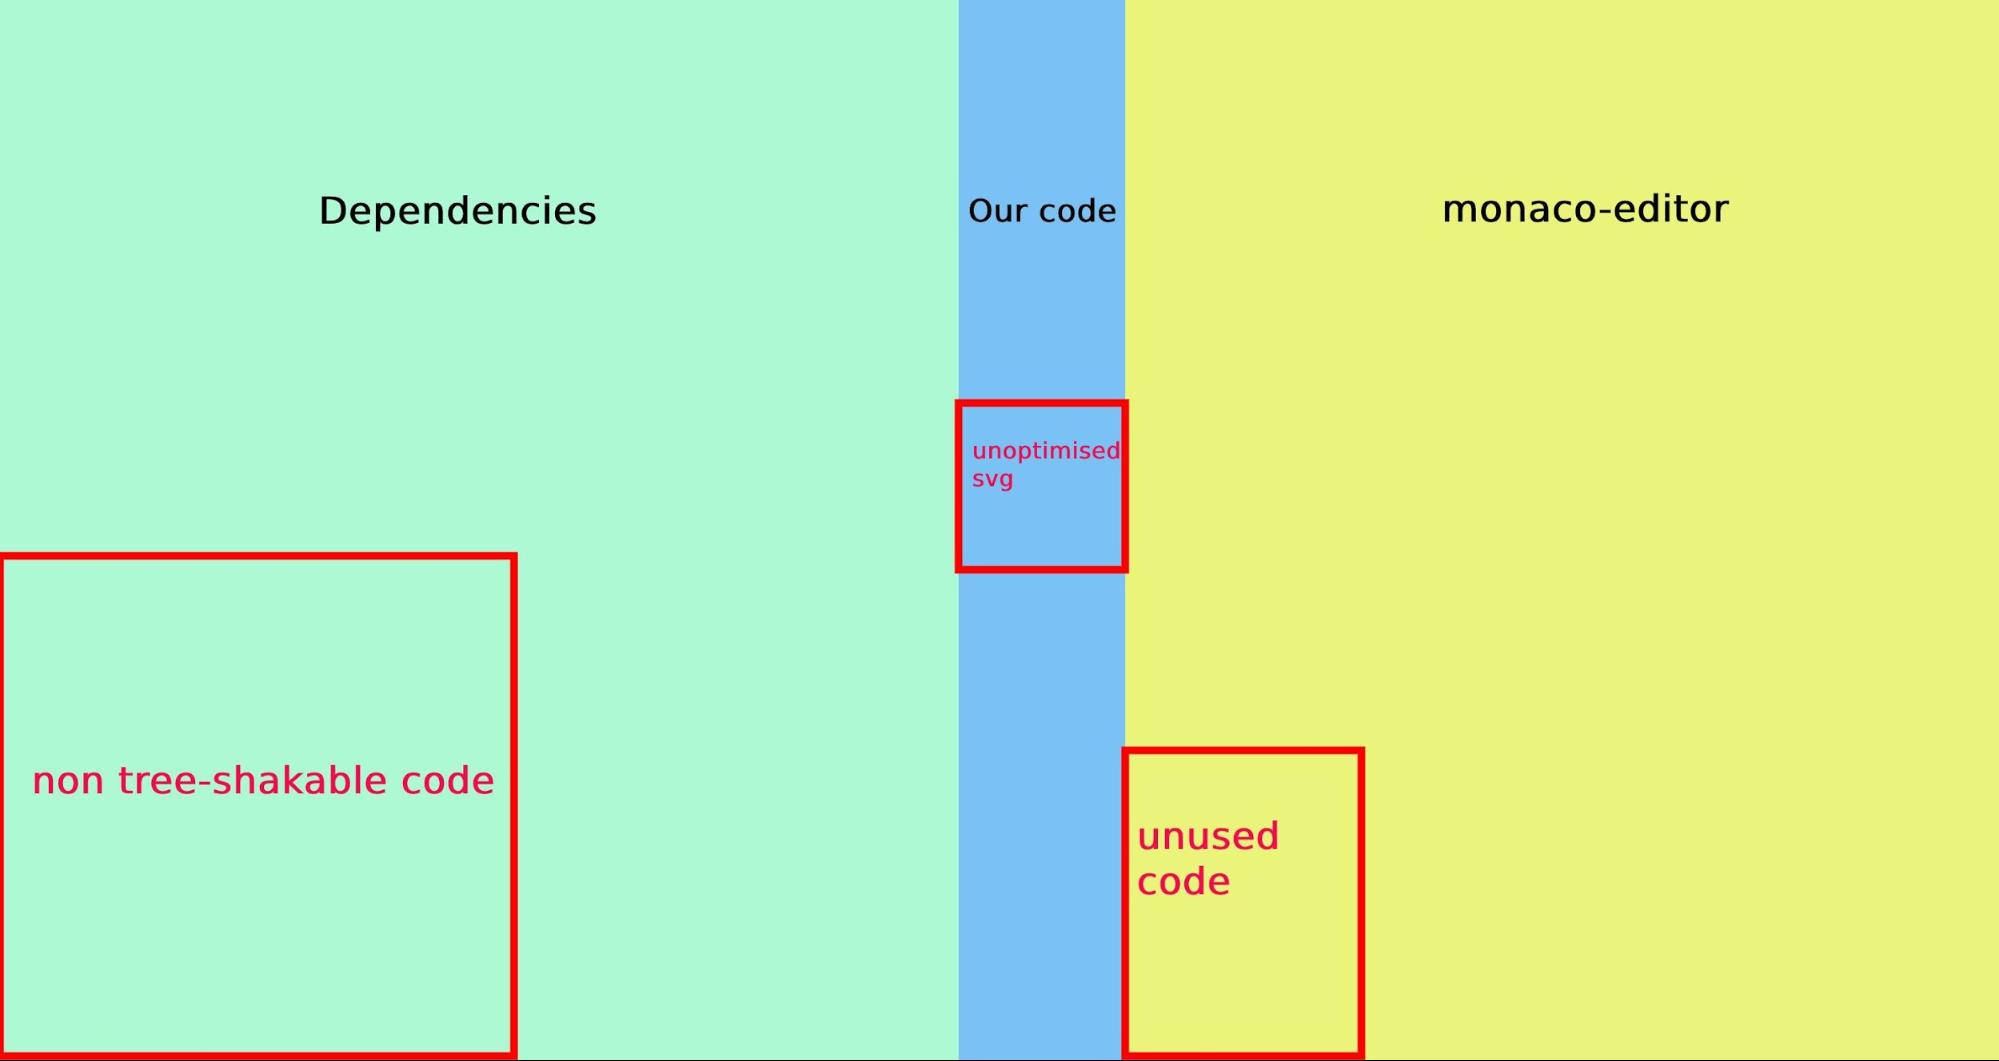
Thanks to webpack-bundle-analyzer you can quickly have a map of your Javascript code and find what should be there or not. We found out our code was < 10% of the bundle size, with a dozen pages and hundreds of components. However, our main dependencies: React.js, Monaco Editor (which is vscode editor), React Feather, Prettier (in combination with Monaco), etc…,constitute the main part of the payload and not everything was tree-shaked and optimised correctly.
Here are our takeaways:
- SVGs can take up quite some space; we saved almost 500kb simply by compressing them correctly
- “module”: “esnext” in tsconfig.json is required to enable tree shaking
- Some packages are not tree-shakable but you can discard the part easily with either
NormalModuleReplacementPluginor anull-loader - Webpack chunks can definitely help when you can’t reduce the size of your bundle
- If you are using nginx,
gzip:onis not enough to enable gzip compression, you also need to specifygzip_types
In just a few tweaks we went from 7.6MB (1.8MB gzipped) to 5.9MB (1.2MB gzipped) so 33% size decrease.
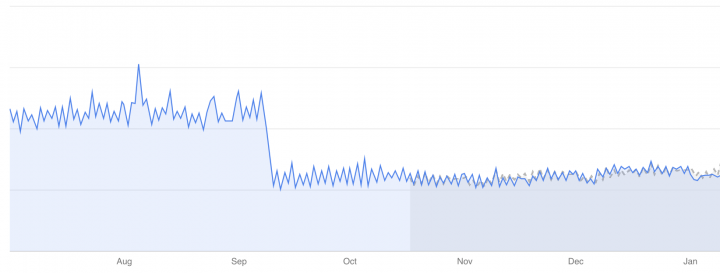
Bandwidth cost, with sharp drop at the end of September
Conclusion
Our Crawler has always been made with stability in mind first and performance second, because we believe people need a reliable tool more than a tool that fails fast. However, we missed out on a lot of easy performance wins that never made it into our top priority because things were just working.
Having a new project and new direction helped put those topics back onto the roadmap and also helped us build a better future for our product.
Number of running crawlers with Netlify spike at the start of October
Not only are we now more confident, but we have already increased our load 2 since the fixes were made in September, and we are confident we’ll achieve 10x in the year to come. In addition, we improved our overall Crawler performance by almost 50%, which is a big win.