Evaluating the best AB testing metrics for search
Evaluating the effectiveness of a search engine or, more broadly, an online system, can be complex. Online systems are perpetually moving — content changes continually, and online users search and behave in unpredictable ways. On top of that, companies are eternally upgrading their systems and adapting to new use cases. In addition to search, this applies to other online systems, such as recommendation engines and question-answer bots. For these reasons, it's important to choose the most reliable and robust AB testing metrics.
This blog is dedicated to demystifying AB testing metrics that measure online search performance. You’ll learn how to assess the reliability of a metric and which factors to consider when measuring AB test success. We’ll look at several popular metrics — increased revenue, conversion rate (CTR or CVR), and click-through rate (CTR) — and compare their good and bad points. This should help you decide which metric or combination of metrics best applies to your type of testing and particular use cases.
Choosing the best AB testing metrics to measure the quality of your search engine
You can measure the quality of a search engine in two ways: quantitatively and qualitatively. Quantitative evaluation looks at metrics such as speed and throughput. Providing fast searching with high throughput is essential. However, your evaluation shouldn’t stop with quantitative measures.
In this article, we’re focusing on qualitative evaluation, which is less straightforward than quantitative. When you hear people talk about the quality of a search engine, they’re often referring to relevance. However, what is relevance? As a starting definition, relevance involves two parts: finding matching records and ordering (or ranking) them in a way that displays the best matches first. But the meaning of search relevance goes deeper, to include other ranking methods such as popularity and higher ratings, displaying results in a certain way (good UI/UX), personalizing and recommending results, and merchandizing.
How can you estimate and evaluate the quality of relevance, even if it has different meanings?
How the subjectivity of relevance makes it difficult to measure search
Many people, such as product managers, search engine experts, and marketers, have different notions of what constitutes good relevance. We can see this in the proposal of the Text REtrieval Conference (TREC). TREC proposes a benchmark that uses a variety of retrieval methods, which indicates that an evaluative benchmark is both dense and complex. Multiple judges are required to provide relevance judgements for query-document pairs. This multiplicity of judgements indicates that users have different expectations of and preferences for the same query. The judgements are then intelligently aggregated to create the benchmark.
So while it may be easy for a judge to distinguish between something obviously relevant or something off topic, it’s more difficult to compare somewhat relevant documents.
For this reason, we usually come up with AB testing metrics that we hope will reflect measurable relevance. But defining such metrics can be complex.
Imagine that an ecommerce company CEO wants its site search technology to generate more net revenue. That sounds like a sane definition of a relevance metric: a search engine that generates more revenue is one that better responds to customers’ needs. So the engineering team starts monitoring this metric. It observes a large sales increase the day the company releases a new version of software. The team concludes that the updated software is responsible for the increase.
However, a week later, they observe a drop in revenue generated by the very same search engine. After investigating, they realize that on the same day as the release, a flagship product was added to the catalog, and it was that event that actually drove the improved revenue for a week, after which the sales levels returned to normal.
As you’ll see, mistaken or misleading conclusions like this can be mitigated by directionality and sensitivity, which essentially ensure that different AB testing metrics are weighted appropriately.
Evaluating AB testing metrics with directionality and sensitivity
Researchers at Yandex Research, an organization that studies machine learning as part of Russia’s leading internet search engine, Yandex, elaborated on the concepts of directionality and sensitivity in this tutorial at the 2019 Special Interest Group on Information Retrieval (SIGIR) conference. In regard to directionality, they said “a good metric must have a clear directional interpretation.”
The revenue scenario above is a good example of directionality: increased revenue is directional in that ecommerce revenue going up is always good and revenue going down is always bad. But an "increased-revenue" metric lacks sensitivity. Yandex defines metric sensitivity as “the ability of the metric to detect the statistically significant difference when the treatment effect exists.”
We can use a sensitive metric to detect the smallest changes applied to the search experience. Thus, while increasing revenue provides a clear interpretation (directionality), this interpretation is unlikely to change much as you test new search experiences. Accurately testing improved revenue can require years of effort because statistical tests are slow to achieve significance. If you launch an AB test to monitor revenue generated by two systems, you may need to run it for months before being confident about the positive or negative impacts of the iteration. While this may be OK in some monitoring situations (e.g., when releasing a radically new ranking system whose impact may need study on a larger scale), it’s not feasible for every iteration. You would just be adding complexity by running too many tests at the same time for months.
With this in mind, a common approach is to derive more sensitive metrics from the directional ones. Two commonly used AB testing metrics are clicks and conversions – technically, click-through rate and conversion rate.
Search CTR & CVR: AB testing analytics signals: conversions & clicks
Search CVR - Conversion rate
The conversion rate is similar to the increased-revenue metric because in ecommerce, a conversion is equivalent to a sale. However, counting numbers of sales differs from calculating revenue: higher revenue doesn’t indicate increased activity because it’s based on margin, not just number of sales. Large margins could skew the results; for instance, a single extra sale with a large margin could indicate increased revenue. Counting sales is more straightforward and unambiguous, but its strength also contains a weakness, as you’ll see later.
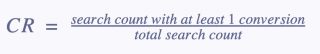
The benefit of using conversion as a measurement is that it is calculated on a smaller scale: search. Because the number of searches fluctuates more rapidly than the number of conversions (customers convert much less frequently than they search), the ratio of searches to conversions could change rapidly if customers convert more often. Conversion therefore can detect system modifications more easily.
Thus, conversion rate is less directional than revenue but can be detected quickly — that is, it’s more sensitive. This property makes it more appropriate for AB testing because it reaches significance more quickly. That said, conversion is not a perfect form of measurement because it treats all sales as equal, which does not offer the same business value that comes from increased revenue.
Click-through rate (Search CTR)
In some situations, especially outside of ecommerce, conversion is an insufficient form of measurement and can be tricky to implement. For example, someone searching for a document may look at multiple files and download only some of them. Are downloads as a conversion signal good as a relevance measure? In this case, CTR is a more sensitive and accessible metric.

CTR is a more sensitive form of measurement than conversion because only clicks are required to change the value. But again, CTR loses some directionality because the user may not go where they want. A click usually, but not always, indicates success. So you may be more quickly trying to reach significance at the cost of making another set of assumptions.
Clicks and conversions are only two signals for sensitive metrics. You can define metrics at the query, user, and session level with clicks, conversion, viewing time, average basket amount, return rates, and time between events. All of these options allow for increasing or decreasing directionality and sensitivity.
Defining robust AB testing metrics
At this point, you’re probably thinking there’s no free lunch, no silver bullet. Certain metrics work in some situations but not others. As we’ll see, when you design an experiment, you should pay extra attention to how well other metrics (such as “time spent”, see below) align with more directional ones.
At Algolia, we adhere to two main properties that all AB testing metrics should take into account to improve the reliability and success of AB testing: be clear about what your metric is measuring and whether it is reliable and could be gamed. We’ll discuss these in detail below.
First, let’s go deeper into the pitfalls of CTR and CTR.
An example of a conversion rate pitfall
Let’s say that in your company’s ecommerce search functionality, you want to boost items that have higher margins. You’ve always used conversion rate to evaluate how well a new system works, so you start monitoring that.

Here, System B differs from System A in that it boosts items that have higher margins. For a similar number of searches, System A performs better in terms of conversion, but B performs better in terms of net revenue. So using the CTR metric to evaluate these systems would be counterproductive if the objective were to generate more revenue by boosting items with higher margins.
Let’s say that after a week, you observe that System B has a lower conversion rate than A. You can expect or assume that displaying too many higher prices will make customers more hesitant to commit to buy and then buy a product, as compared with a system that displays a wider range of prices. However, system B may ultimately generate more revenue. This example illustrates that metrics should not be used blindly, as different use cases call for different metrics. In this scenario, we can combine CTR with increased revenue by monitoring the conversion rate weighted with the margin of items (or margin rate, MR).
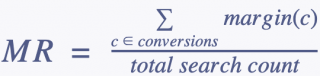
We would retain roughly the same sensitivity as we continue to rely on the number of searches, but we integrated the conversion impact on the business’s revenue growth, making the metric more directional.
Click-through-rate (Search CTR) pitfalls
Because there are no silver bullets, the CTR is also exposed to some potential snags. Sometimes a lower CTR actually means better results! Consider a domain-specific search, where the search is performed by a student or an expert researching a subject. A common use case would be someone looking for answers to a query like "I want to know whether medication X causes certain side effects” in a vast number of lengthy documents. In this case, the answer is fairly simple, so tediously browsing documents should be unnecessary. For this reason, your team might decide to build a new solution consisting of informative snippets with answers (like Google, which displays snippets when it can detect an answer to a question.)
In this situation, you would expect the CTR to go down because with certain queries, users won’t have to click results to get an answer. This is why CTR can be less directional: in some situations, a drop in the CTR indicates higher relevance.
Thus, while in an ecommerce setting, higher CTR correlates with higher user engagement and satisfaction, in the case of answering a question, or in research in general, you might want to use a metric such as time spent (TS) between sessions: a low TS in document-based research indicates that users are so satisfied with the expertise of the website that they will come back immediately to enter another query. As a result, TS may be the most relevant metric to monitor after iteration in a document-based search system.
Creating more reliable AB testing analytics & metrics
We’ve discussed examples of signals you can combine, where each combination provides more or less directionality or sensitivity. But how do you decide which combination is best?
In general, every useful metric should have two properties:
- The direction in which you expect it to go given your assumptions about how the treatment applied to the search system should affect the user experience
- An inability to game the metric
We’ve discussed the first bullet point — direction; let’s move on to metrics gaming.
Imagine an online platform that hosts a variety of content from different authors. Let’s say it has a recommendation engine that pushes content to users. You want to improve the quality of this engine. After spending months developing recommendations, you release a new version and start monitoring the number of clicks using CTR. After all, clicks give you a reliable signal for evaluating relevance.
However, you may face the clickbait problem: Since you don’t have control over the content that’s published, authors can game the system by publishing articles with more attractive titles and images, yet poor content, which may be clicked on more than duller-looking articles that contain relevant content. CTR measures increased activity without accounting for clickbait. So your recommendations system has been gamed: an increased number of clicks does not indicate a better system of recommendations.
Not only authors can game this metric. So can a blog platform: some media platforms accidentally game its zero-results page by returning the most popular articles regardless of whether the search contains words that match the user’s query. While this ensures that the search engine provides results, the results aren’t necessarily relevant! Relying on synonyms or related queries would also reduce the zero-result rate without gaming it.
The solution? Avoid being gamed by not relying on a single type of metric.
Conclusions and takeaways
Sigh…there is no perfect metric. In many cases, defining a single AB testing metric simply will not cut it. For example, in the article-recommendation scenario, when you look at CTR, you also need to look at the bounce rate: did the user actually read the article?
A good first step is to review your business objectives for your online system and use strong directional metrics that show improved business value, such as the increased-revenue metric. Measuring business value can help you define expectations for how the system should behave given the changes you make. However, increased revenue is slower and more sensitive than other metrics. You can improve this by adding a set of candidate metrics that also reflect your business objectives, but at a more granular level (e.g., at the search, session, or user level).
Finally, pay attention to whether your metrics can be gamed, either intentionally or accidentally. The whole purpose of AB testing is to pragmatically evaluate a system. Ideally, you should measure real and un-gamed changes that go in your expected direction during an AB test, thereby reliably conveying that the last iteration was a success.